
COO @ Quorivex Systems
We wanted to automate a few workflows but weren't sure where to start. Lampros helped us cut through the noise and get something useful into production quickly.

CTO @ Teralynx Systems
They picked up our processes surprisingly fast and built around how we already worked instead of forcing us into a new system.

Financial Technology Company
We saw value pretty quickly. A lot of repetitive work that used to take hours every week simply stopped being a problem. Our team could focus on higher-value work instead.
Contact Us
Ready to Ship AI Systems to
Let's align architecture, execution, and delivery from day one.
Published On Sep 23, 2025
Updated On Sep 23, 2025

From $61B+ in DEXs' trading volume to over 6M+ wallets onboarded, Unichain’s early growth is significant.
Yet the concentration behind that growth is even more revealing. Liquidity is deep but highly dependent on a single protocol, a dynamic that makes Unichain a live case study for DeFi’s next phase.
In 2026, the Layer 2 race is no longer just about speed or throughput. The real test is whether new infrastructure can ease liquidity fragmentation, cut execution costs, and deliver smoother cross-chain experiences.
This Unichain dashboard analysis places the chain within the broader Layer 2 race. From adoption and liquidity to execution reliability and costs, the data surfaces signals that extend beyond one network and hint at where DeFi is headed next.
Let’s get started.
The dashboard provides a clear snapshot of Unichain’s position in September 2025. The numbers highlight both rapid early adoption and structural risks that will shape its trajectory going forward:
Unichain processes meaningful size with strong adoption, low fees, and reliable execution. But the same data points also highlight the risks; liquidity remains heavily concentrated, and long-term sustainability will hinge on whether usage diversifies across protocols and cohorts.
To understand whether this growth is momentum or maturity, we need to look closely at adoption, like wallet onboarding, transaction activity, and developer integrations, which provide a clearer signal of Unichain’s trajectory than TVL alone.
The dashboard data tells us whether a chain can sustain scale without compromising user experience.
In Unichain’s case, the analytics highlight both the strengths of its architecture and the context behind observed failure rates.
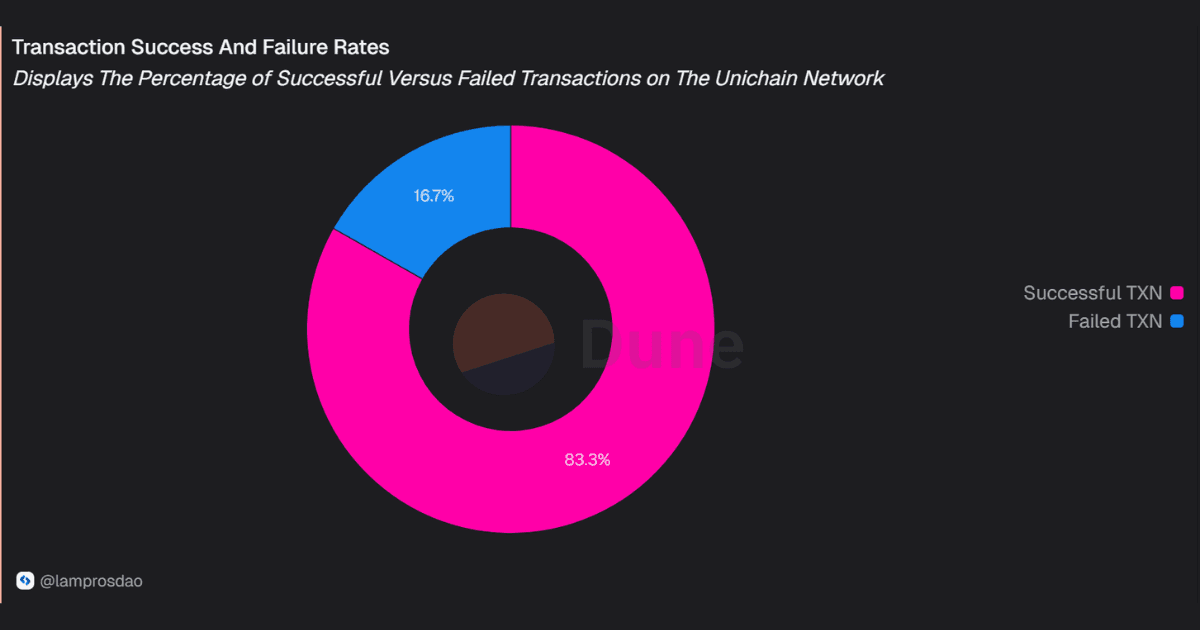
Here are the key metrics to look at, starting with success rate, the clearest indicator of reliability.
As of September 2025, Unichain maintains a success rate of 83.3%, with 16.7% of transactions failing.
While the majority of activity settles reliably, the failure rate is not insignificant and highlights areas where execution efficiency can improve as the network scales.
Unichain processes up to one million daily transactions, with success rates holding above 80% even during peak load. Failures scale with overall volume but do not overwhelm throughput.
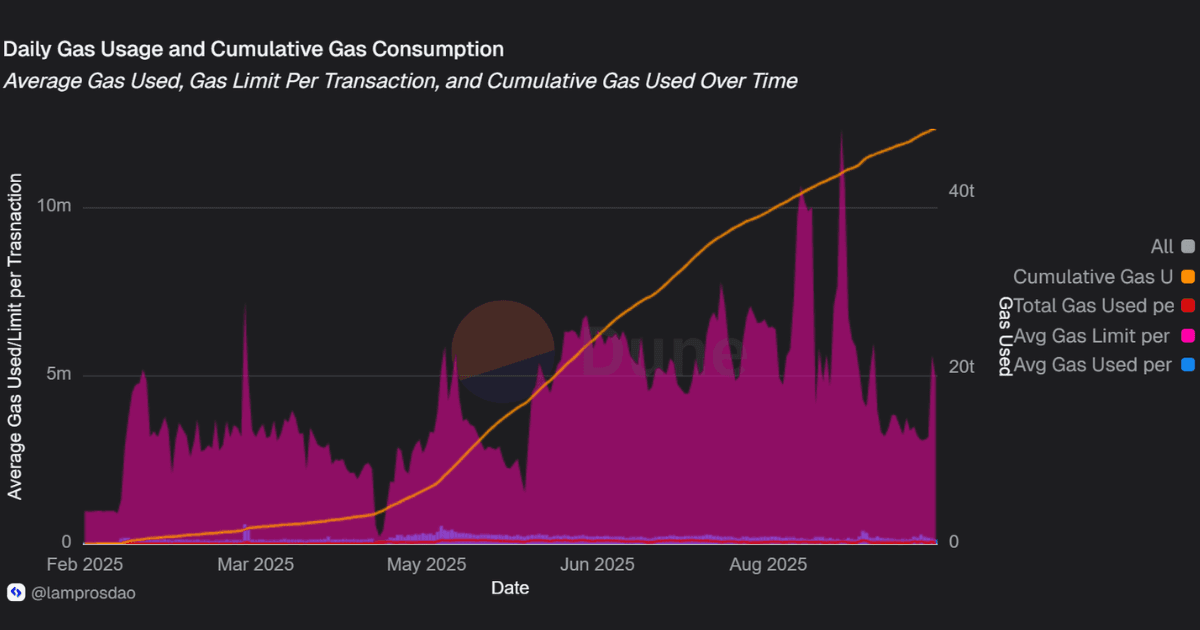
Gas usage reinforces this picture: successful transactions average 0.0002361 GWEI, while failed ones use 0.0000783 GWEI.
Most network resources are therefore tied to transactions that finalise, keeping inefficiency limited.
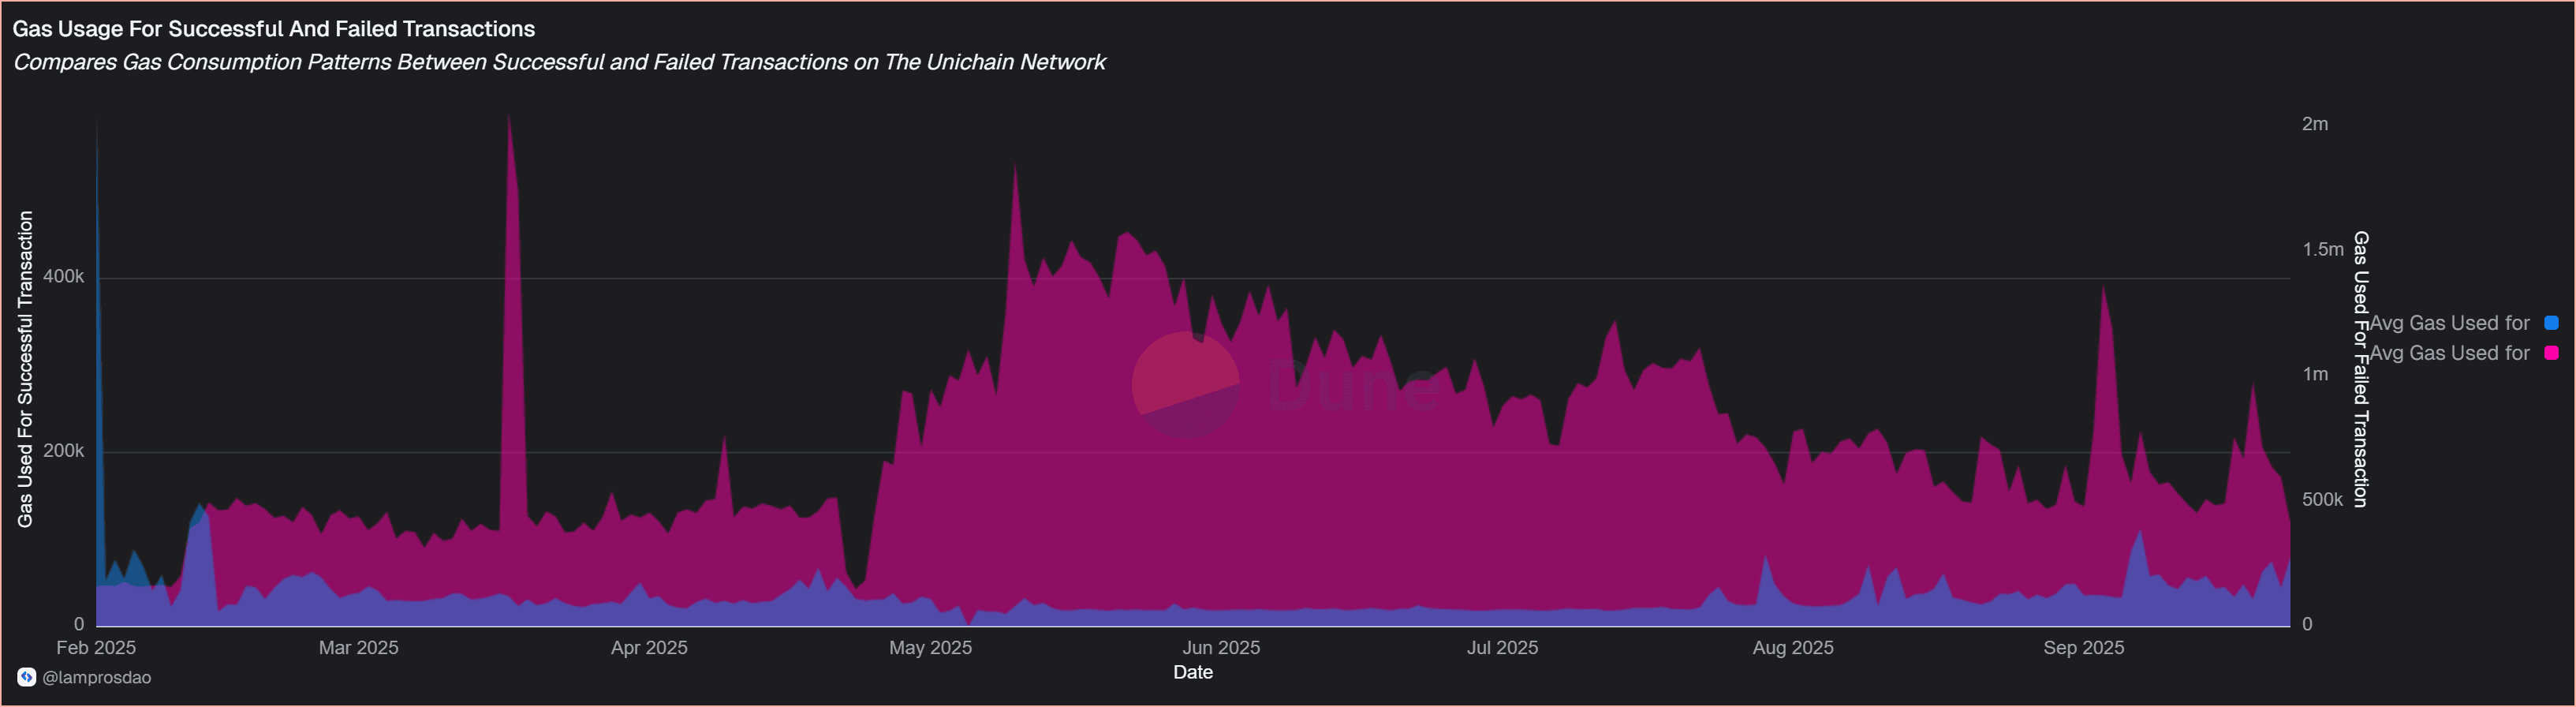
Overall, the data suggests a system that absorbs heavy activity efficiently, though the non-trivial failure rate signals there is still room for optimisation as usage scales.
Next, we look at execution speed, block times, confirmations, and throughput to see how the dashboard captures Unichain's performance in terms of efficiency.
Beyond reliability, execution speed defines how efficiently the network processes activity. The following metrics track block confirmation, transaction throughput, gas utilisation, and contract deployment.
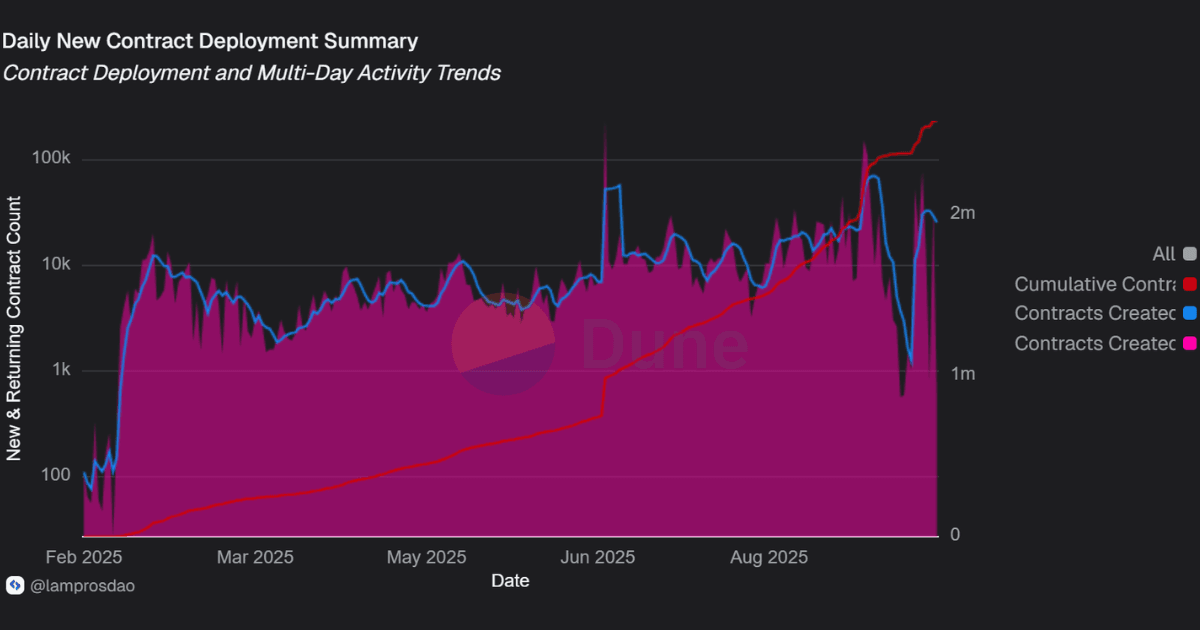
Contract creation is a proxy for how actively developers are building on the network.
High deployment counts suggest that Unichain is not only processing user transactions but also attracting builders who are expanding the ecosystem’s scope.
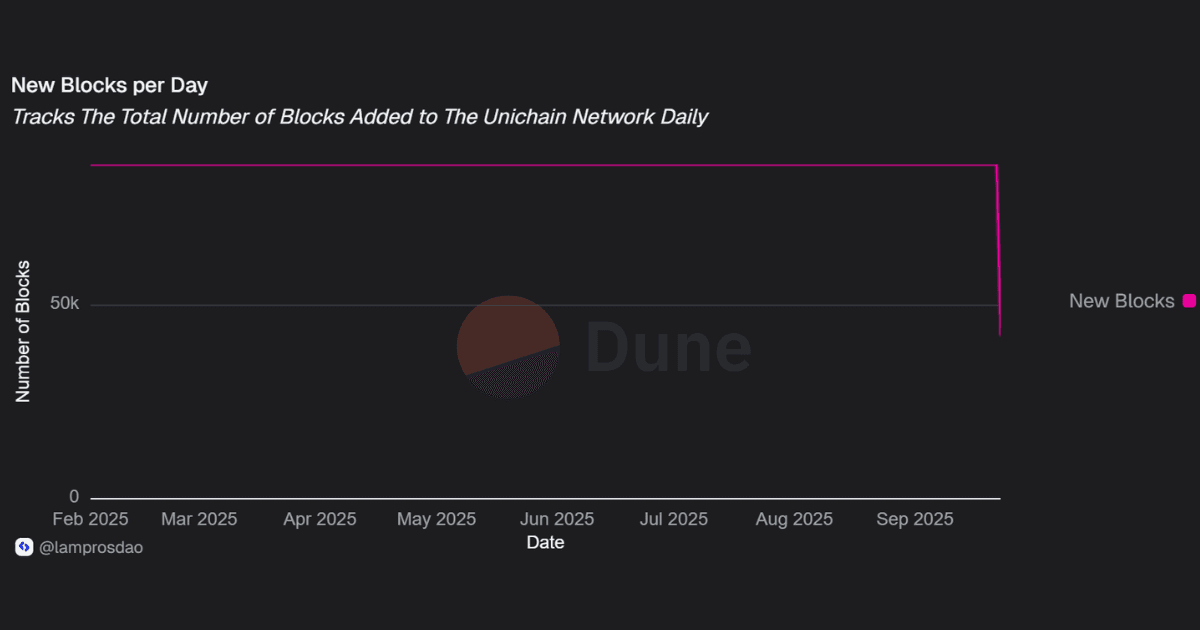
Block production speed is the first indicator of execution efficiency. Dashboard reveals that blocks were finalised almost instantly, keeping settlement times predictable for both users and applications.
Throughput shows how much activity a network can handle over time, and whether scale holds steady as adoption grows.
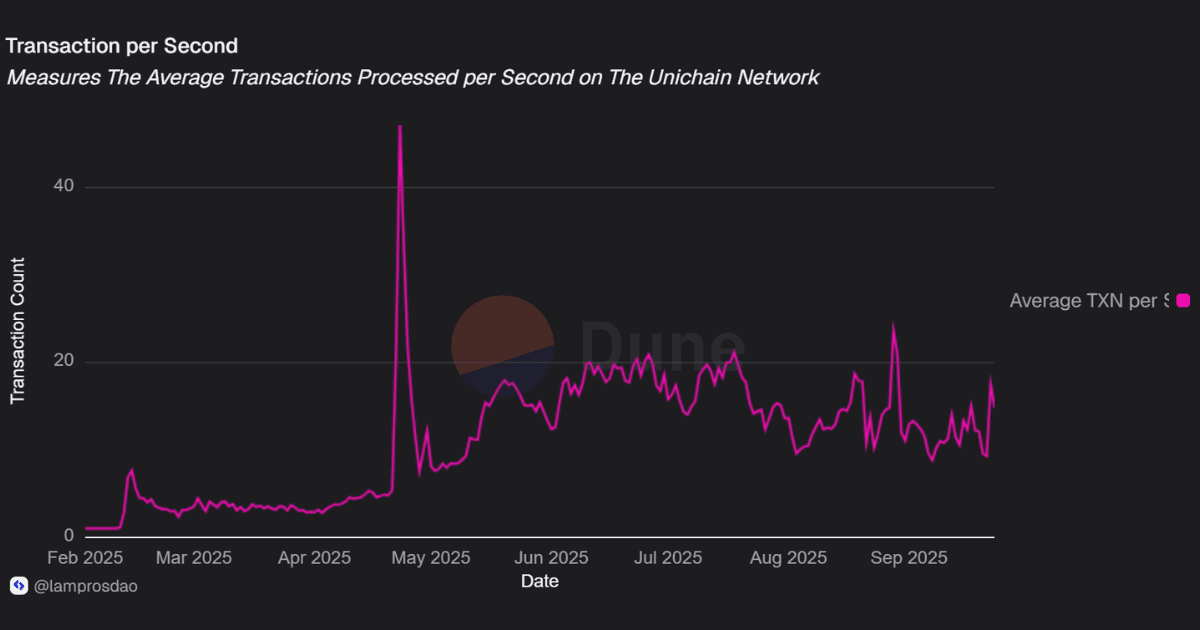
Even without full TPS and size data, the total transaction count already places Unichain among the more active Layer 2s in its growth stage, showing that the network has been stress-tested by real user activity.
Gas metrics show whether a network is operating near its limits or with room to scale further.
On Unichain, both per-second gas usage and daily utilisation relative to the gas limit reveal a system that is efficient and not close to saturation.
Gas utilisation measures how much of the network’s total capacity is actually being consumed.
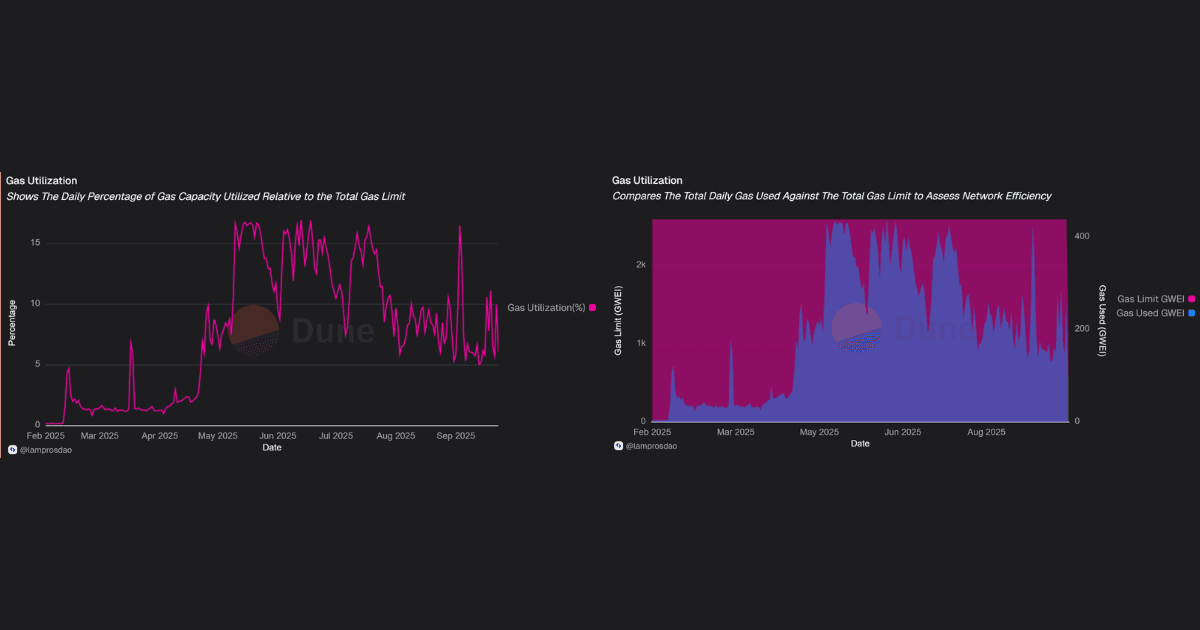
Low utilisation percentages suggest that Unichain has designed its capacity with significant overhead.
For users, this translates into predictable costs and stable performance; for builders, it signals that the network can absorb higher adoption without immediate scalability bottlenecks.
Next, we look at user metrics, which are wallets, activity, and retention, to see how that performance translates into adoption.
User adoption is the clearest test of whether execution performance is translating into real usage.
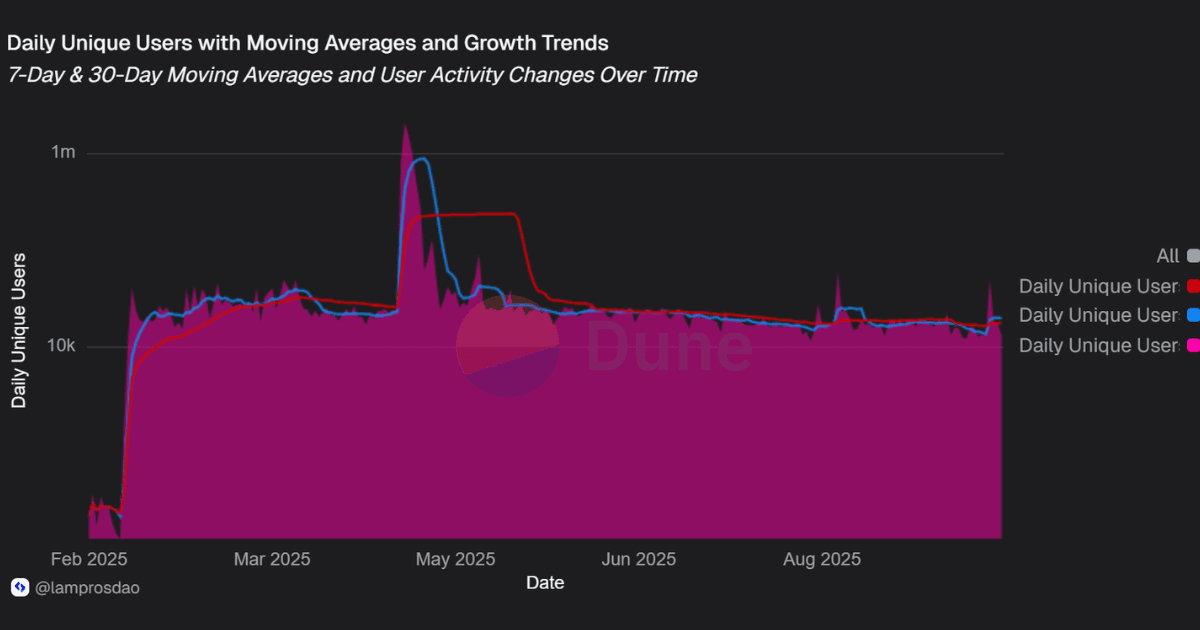
Distinct addresses: Unichain has reached 6,394,551 unique addresses, reflecting rapid onboarding in its first months.
Distribution by user activity:
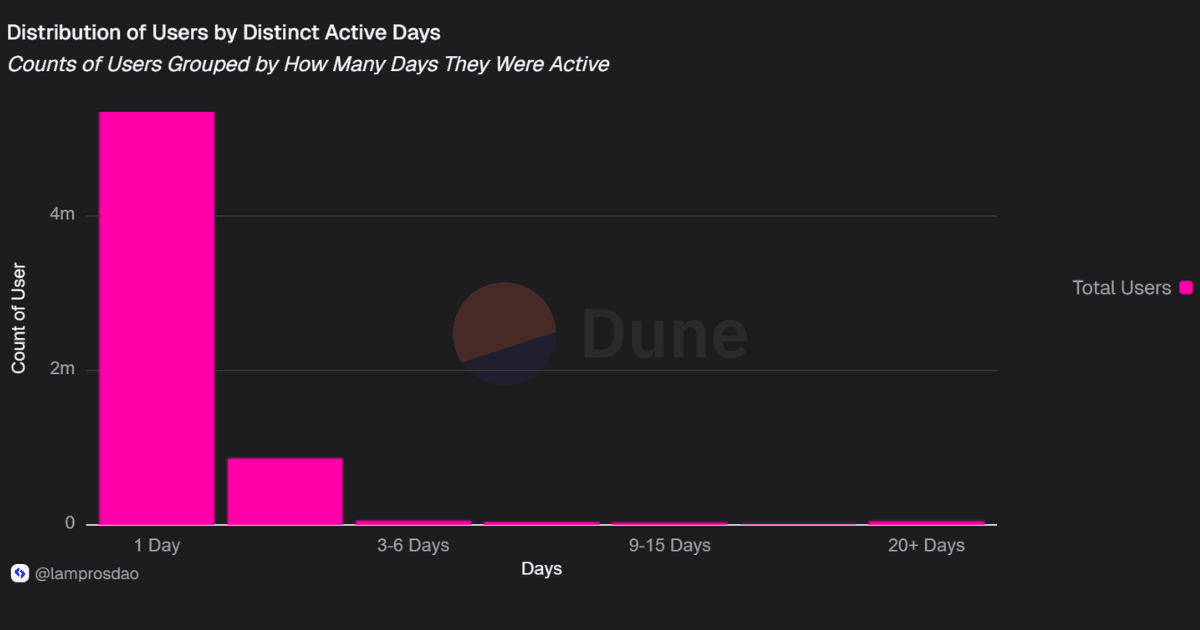
This distribution shows that most wallets interact only once, while a smaller share maintains consistent activity.
Last 30-day breakdown:
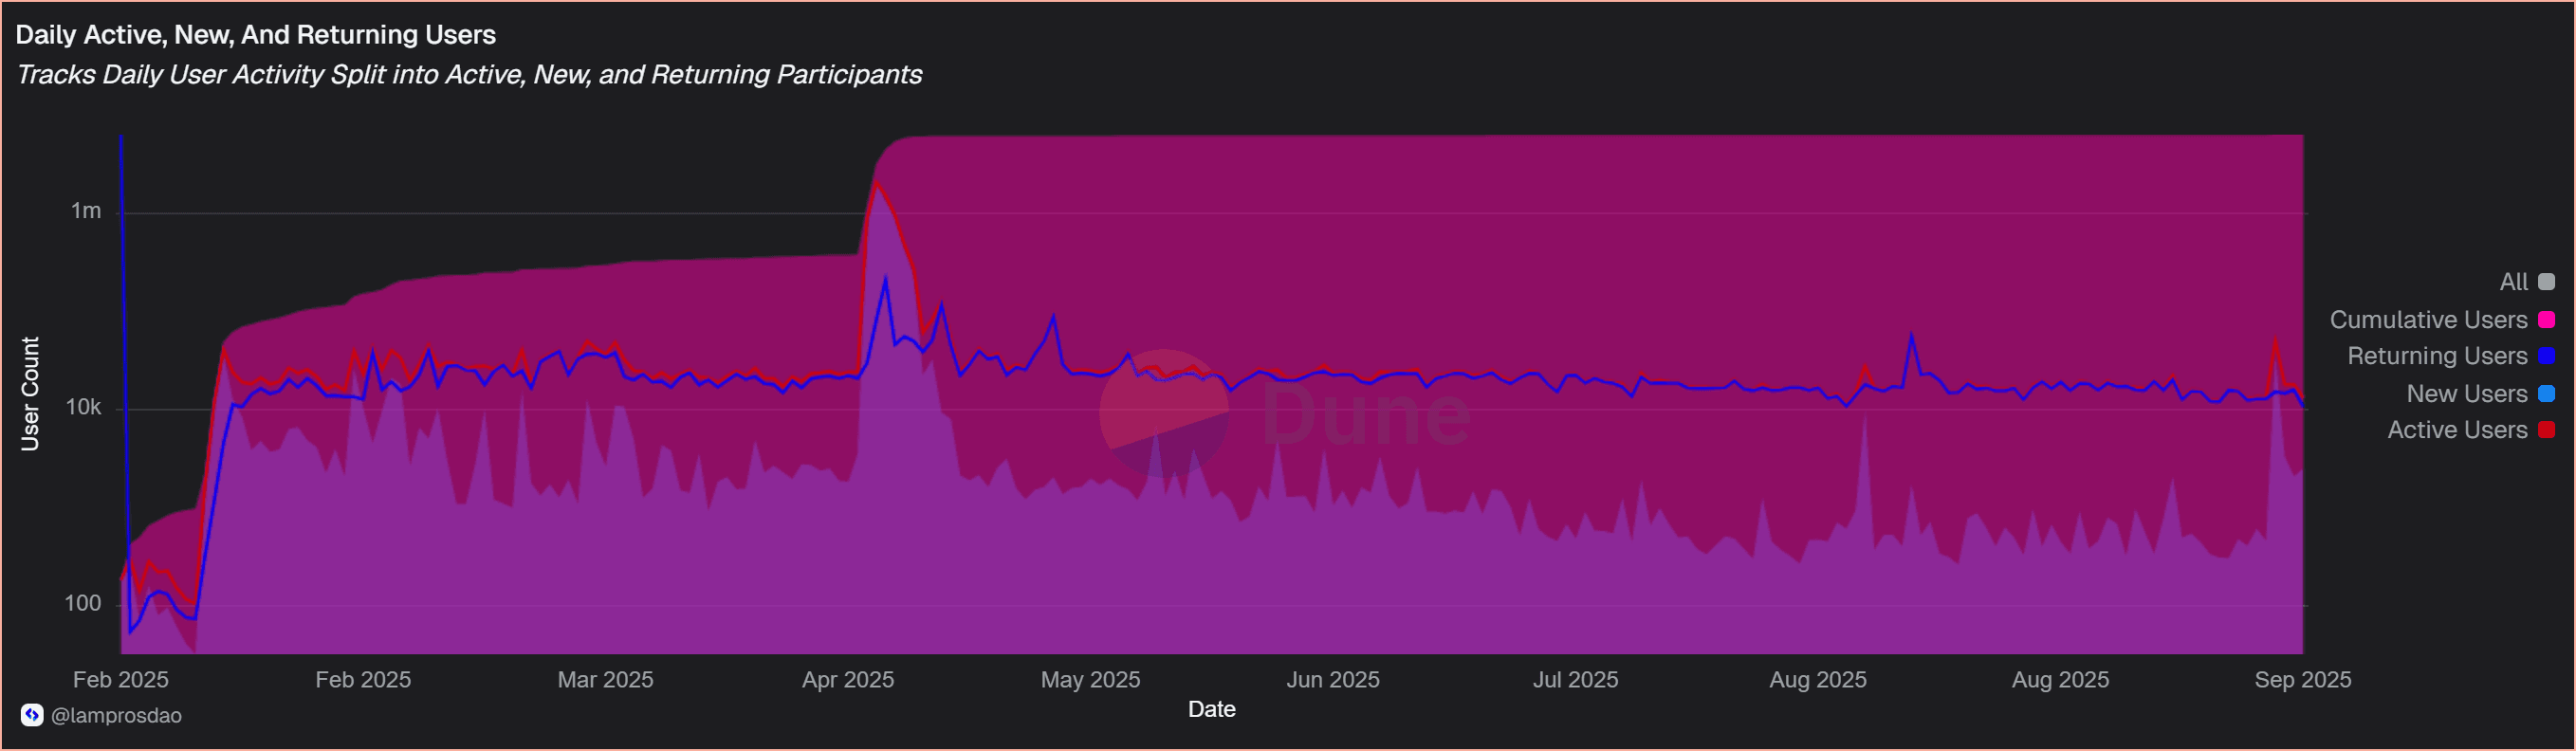
Returning users outnumber new ones, suggesting early signs of stickiness despite overall activity being a fraction of total onboarded wallets.
While address counts have surged, most are tied to single-day activity, raising questions about how much of this growth reflects sustained user engagement.
Cost, however, is one factor that directly influences whether users return, and Unichain’s low gas fees play a central role in shaping that behaviour.
Gas costs directly shape how users and protocols behave.
For Unichain, consistently low fees are one of the strongest drivers of adoption, making high-frequency transactions, automation, and micro-activity viable at scale.
Gas costs remain consistently low relative to transaction volume, confirming that the network can scale without pushing users into fee-driven drop-off.
The challenge is less about affordability and more about sustaining activity levels that justify such high cumulative consumption.
One of the main reasons users and protocols move to Layer 2 is cost. Unichain’s fee data highlights how expenses are distributed across layers and what it means for day-to-day usage.
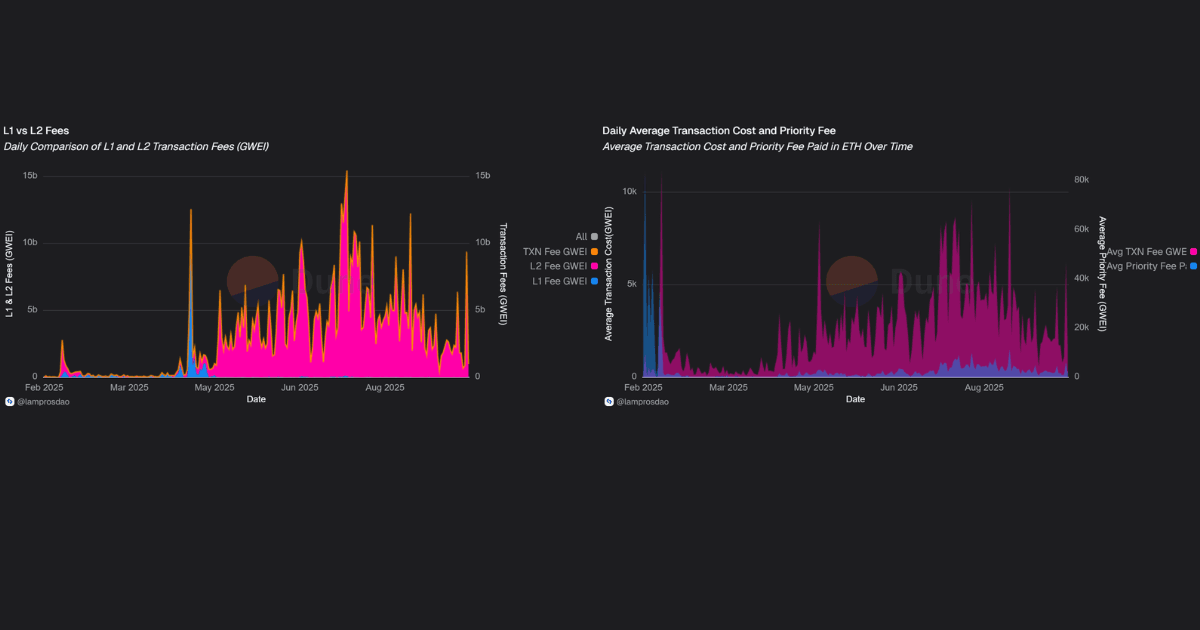
This indicates that most of the costs users experience on Unichain originate from execution and priority bidding within the rollup itself, rather than from settling back to Ethereum.
While the total average transaction cost remains much lower than doing the same activity on L1, the priority fee component (2,483 GWEI) signals that demand for fast inclusion is already shaping Unichain’s fee market.
Contract-level data shows that usage is spread across both new and older deployments:
Activity varies by contract age:
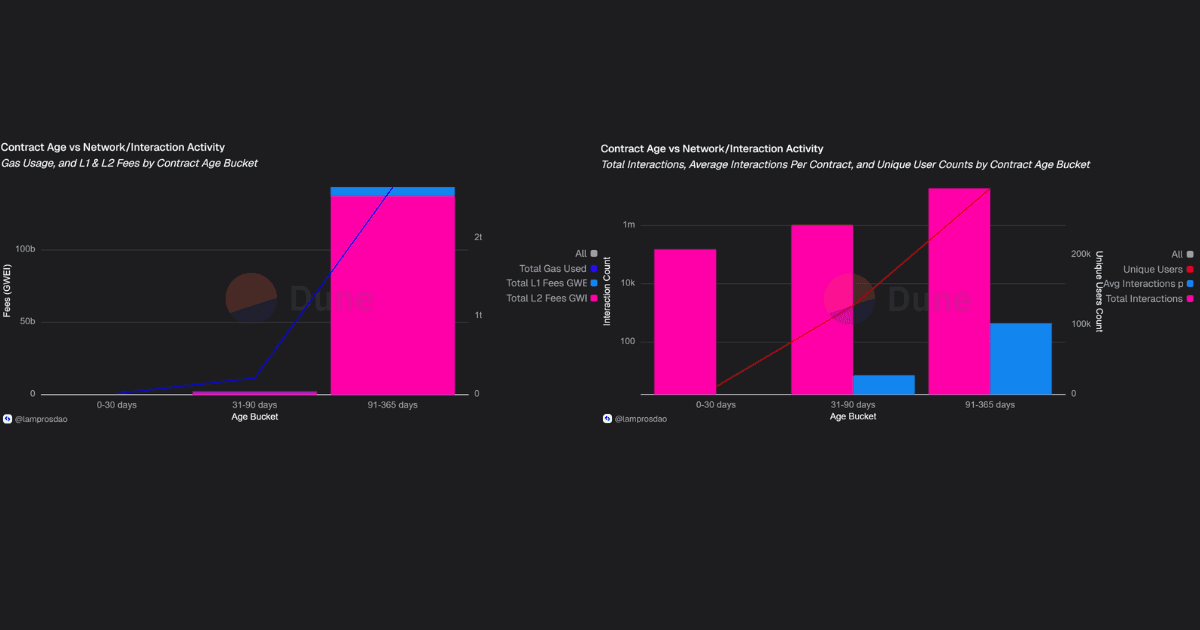
Most activity comes from established contracts, while new ones drive experimentation but have yet to match sustained adoption.
Low fees remain one of Unichain’s defining features. Stable gas prices, lower costs than L1, and efficiency across both new and mature contracts point to a network designed to support high-frequency DeFi, automation, and everyday user activity without cost barriers.
With low fees in place, the next lens is DEX activity on Unichain, the clearest measure of how users and liquidity interact within this ecosystem.
For Unichain, DEX metrics highlight how liquidity flows and how users engage with it.
The dashboard captures trading volumes, active users, and contract-level activity, making clear where value is pooling and how it evolves.
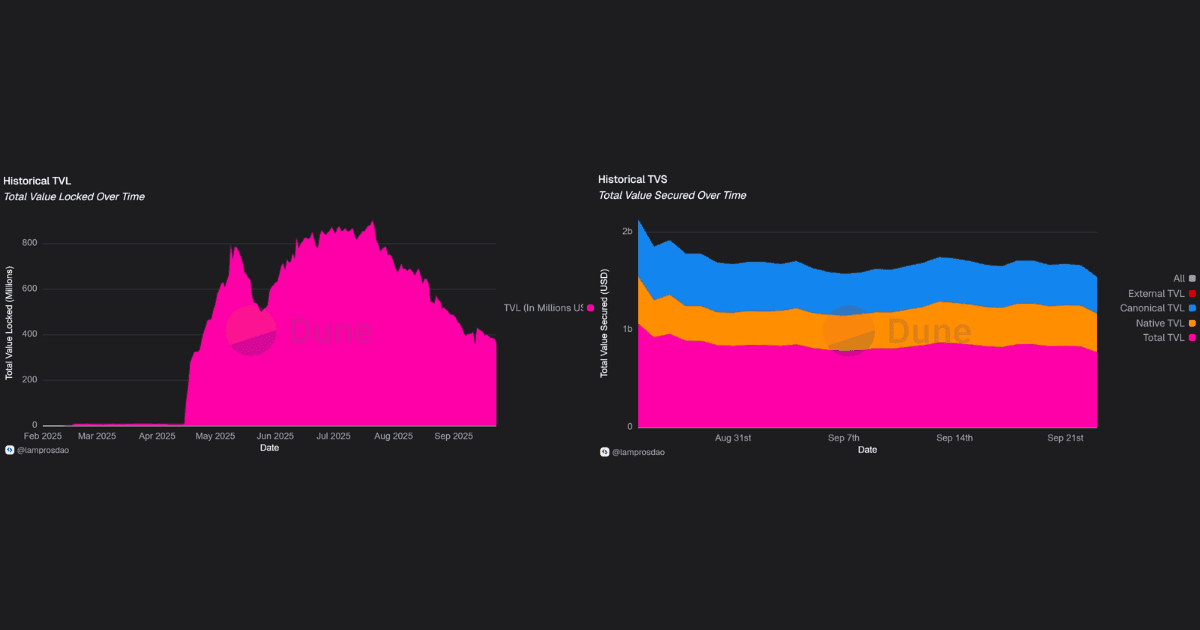
Liquidity is meaningful but heavily concentrated. The TVS figure shows the collateral secured across Unichain’s DEX contracts.
Unichain DEX processes billions in monthly volume, with activity split between frequent small trades and occasional large flows, showing breadth of usage but a relatively concentrated trader base.
In the past 30 days, Unichain DEX activity highlights both scale and diversity of participation:
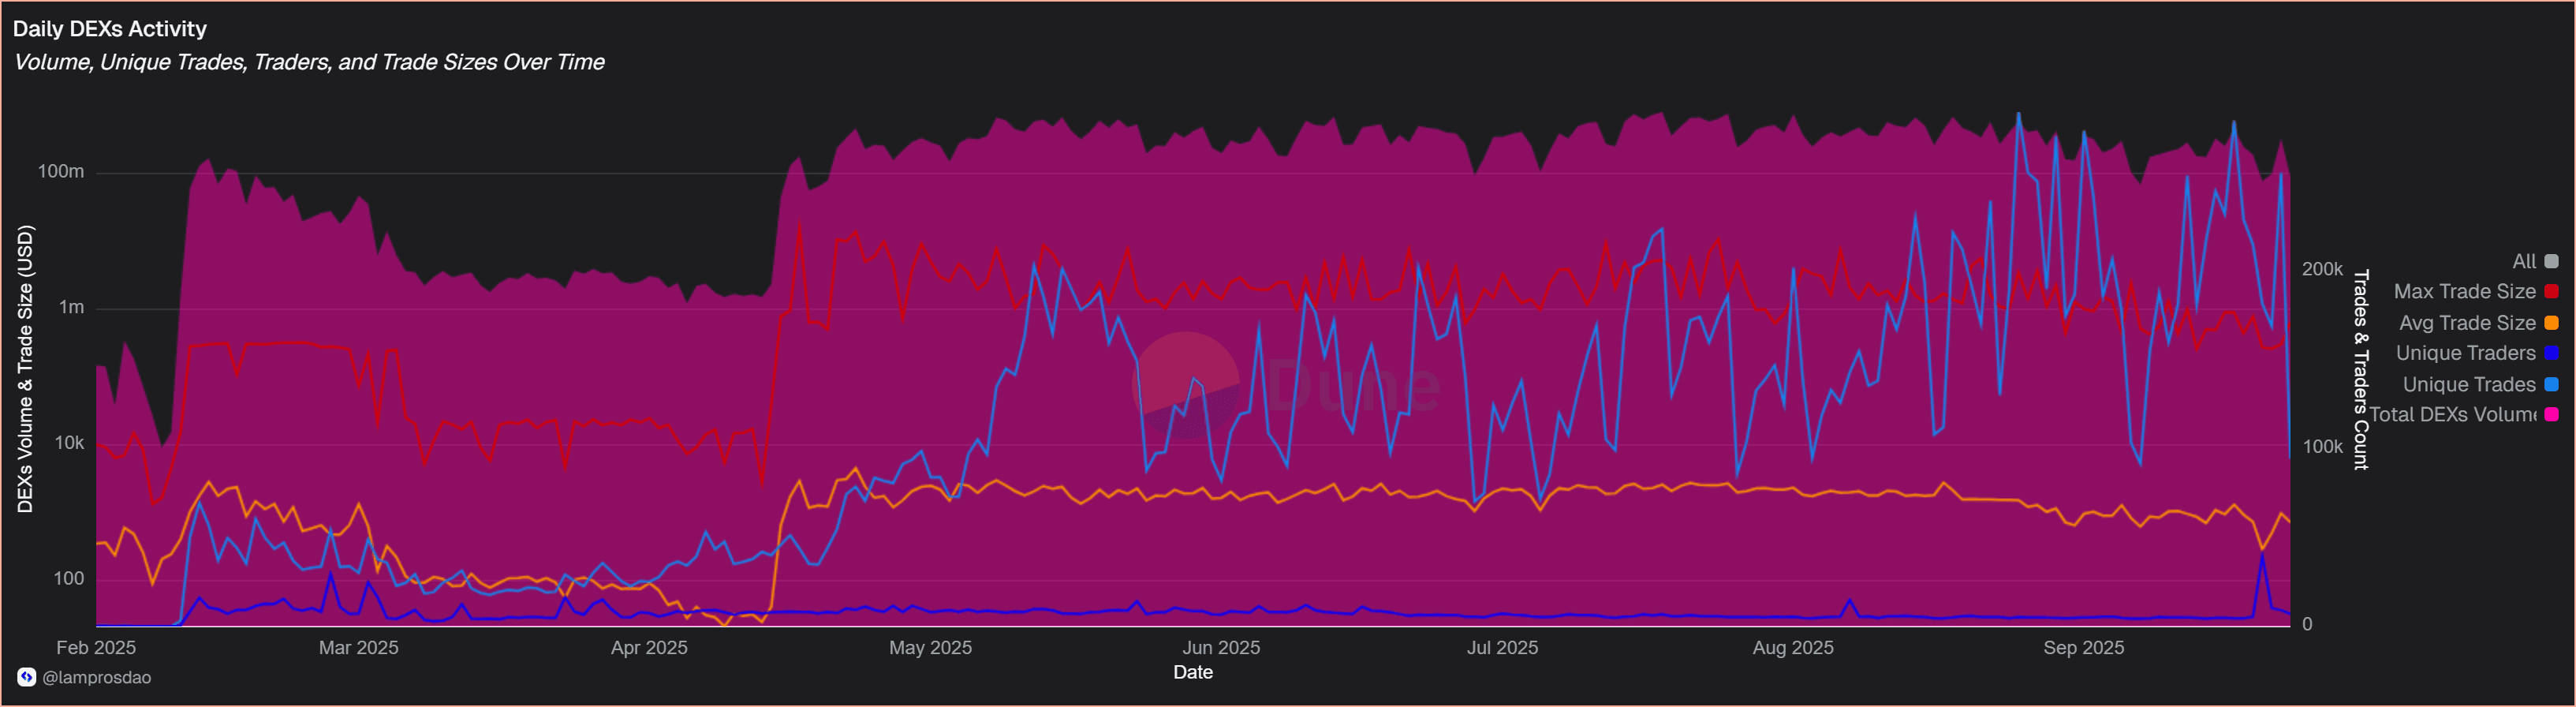
Volumes consistently run into the hundreds of millions. The mix of sub-$1K average trades alongside multi-million-dollar transactions suggests participation across both retail and institutional segments.
User participation shows consistent engagement on Unichain DEXs, though
cumulative totals suggest adoption is still building toward a broader scale.
New contract deployments are 2.5M + on Unichain and continue steadily, showing ongoing DEX experimentation and liquidity pool launches.
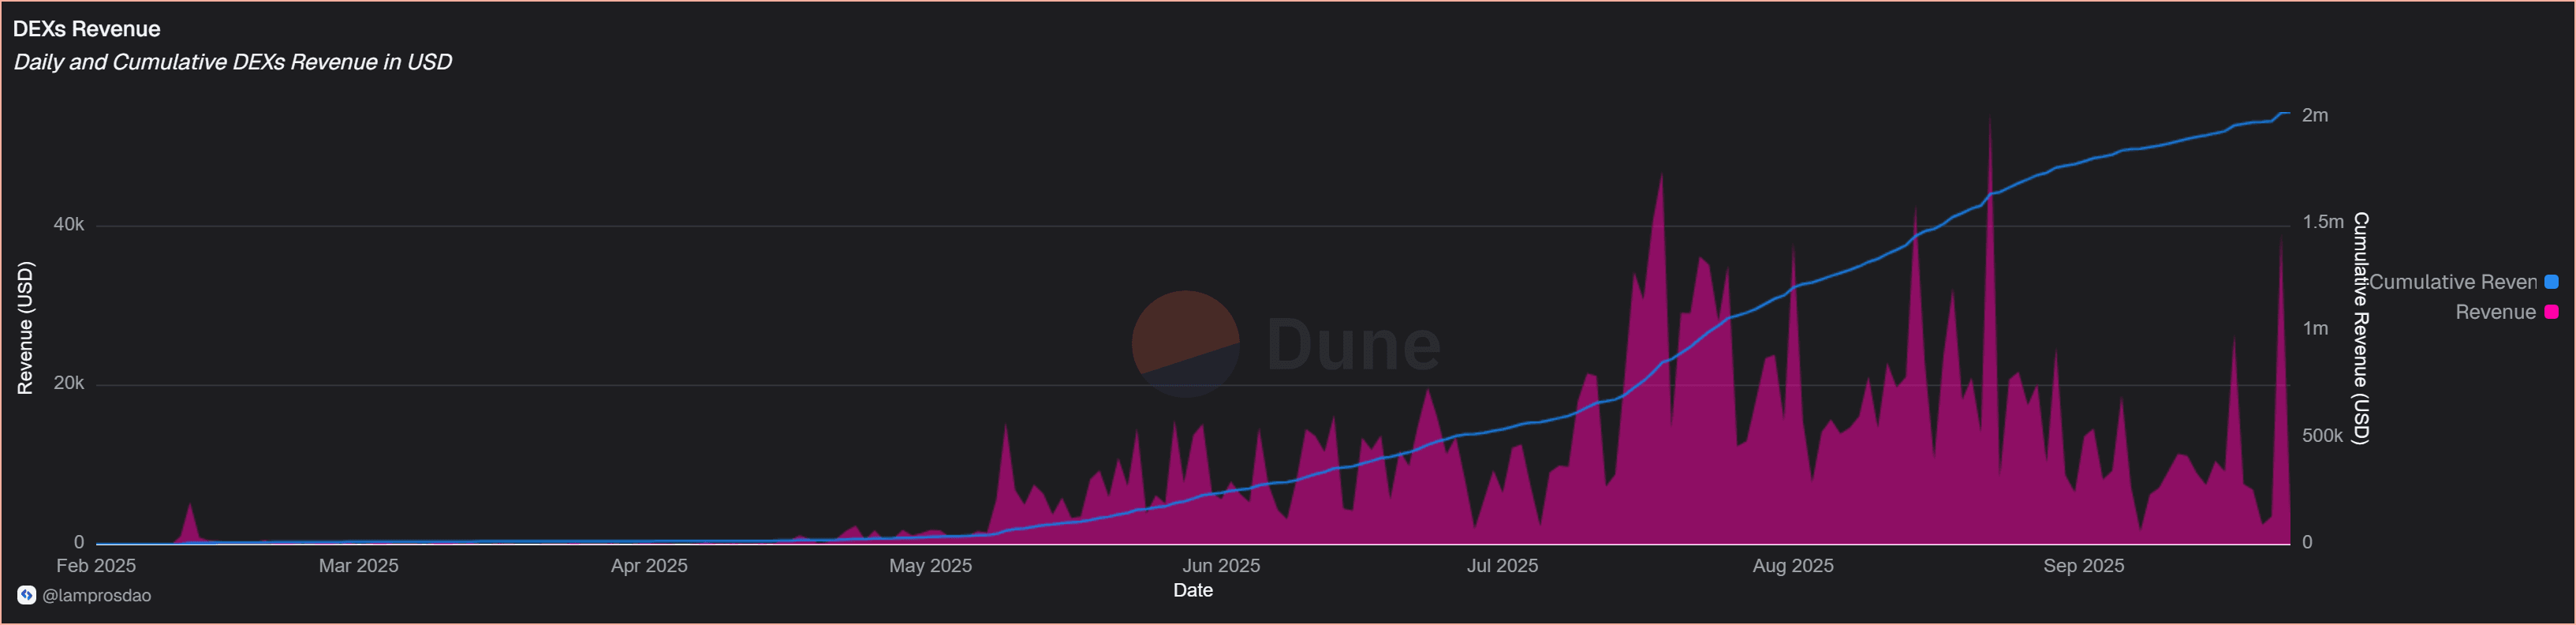
High gas consumption paired with sustained fee flows confirms that Unichain’s DEX layer is not only active but also economically viable.
DEX metrics show Unichain as liquidity-rich yet concentrated, with consistent user engagement and active contract deployment.
Strong trading volumes and revenue validate activity at scale, but broader liquidity diversification will determine its resilience.
The data shows that Unichain is growing fast, but it is also facing the same questions that define any new execution layer:
These signals point to larger themes across the L2 landscape. Dashboards like this make it possible to see where growth is durable and where risks are hidden.
Without data, liquidity and adoption stories blur into narrative; with data, they become measurable.
The same patterns connect closely with Challenges of Web3 Data: Volume, Velocity, and Veracity, where scaling ecosystems increasingly struggle to balance growth with reliability of insights.
The Unichain dashboard in this analysis is one example of how Lampros Tech approaches blockchain data.
Turning millions of transactions into clear, actionable metrics requires more than queries; it takes structured pipelines, efficient indexing, and the ability to surface insights that scale with network activity.
Our team has the resources and technical depth to build dashboards like this across ecosystems:
For protocols, DAOs, or chains, dashboards like this make adoption, execution, and liquidity measurable. That’s what Lampros Tech delivers.
The Unichain dashboard is one example of how Lampros Tech structures blockchain data into production-ready analytics.
From indexing raw logs to cross-chain dashboards, we deliver clarity that protocols and DAOs rely on. To go deeper, explore our Web3 Data Analytics services.

The Unichain Dashboard provides real-time insights into wallet adoption, liquidity depth, trading volume, and gas efficiency. In 2025, with DeFi activity expanding worldwide, it help protocols, DAOs, and investors evaluate Unichain’s growth and risks compared to other global Layer 2 ecosystems.
As of September 2025, Unichain has onboarded more than 6.3 million unique wallets, with daily transactions ranging between 500K and 1M. While adoption is strong globally, long-term growth depends on retaining active users rather than one-time wallet activity.
Yes. Unichain’s average transaction cost is significantly lower than Ethereum L1, making high-frequency trading and automation viable. Compared to other L2s, its fees remain competitive, though priority fees show growing demand for fast settlement. This cost advantage supports global DeFi adoption in 2025.
Liquidity on Unichain is deep but heavily concentrated in one protocol. If that protocol faces a disruption, much of the network’s activity could be at risk. Globally, DeFi investors and protocols prefer diversified liquidity, which strengthens network resilience across regions and ecosystems.
Unichain offers near-instant block confirmations, low gas fees, and strong developer activity with over 2.5M contracts deployed. However, compared to other Layer 2s like Arbitrum, Optimism, or Base, it must improve transaction success rates and user retention to achieve sustainable worldwide adoption.